RECENT ARTICLES
- CEBRA: An optimised and standardised sampling protocol for BioBlitz
- Stop it people, the plural of anecdote IS data!
- That's no pollinator, that's a flower visitor
- Add a scale to your macro photos
- What to photograph when counting the wild
- Imagine counting the wild on EVERY street in a city!
- My wild counting workflow
- A butterfly flew through
- Why iNaturalist observations without photos can be research grade
- Why you shouldn’t use a spreadsheet for data entry
- All articles ...
Why you shouldn’t use a spreadsheet for data entry
Seriously, people. Step away from the spreadsheets.
written Feb 10, 2019 (last updated Oct 29, 2023) • by jonsullivan • Category: Data Wrangling

If you wanted people, with no artistic training, to manually copy a painting, would you give them blank canvases, or detailed paint-by-numbers sets? With paint-by-numbers, if everyone puts the right colours on the right numbers, they’ll make a good product. Not necessarily great, but all good. With blank canvases, you’ll get a wide diversity of mostly wildly inaccurate interpretations (although some potentially creative).
When we make wild counts, the paintings we’re trying to copy are pieces of reality in the natural world. Databases make the paint-by-numbers sets, and nature tells you what colour to put where. Spreadsheets are the blank canvases.
Spreadsheets are seductively simple and people are naturally overconfident. That’s a really dangerous mix. I’ve learned the hard way, repeatedly, that only the most ruthlessly pedantic and talented people should ever enter biological data into spreadsheets. Most people just open up a spreadsheet, type in a few column headings, and start entering. That’s a recipe for a mess.
It is possible to carefully set up a a spreadsheet with validation and drop-down lists and locked cells so that they are almost as structured and constrained as an average database. In a similar way, it would be possible to carefully trace a paint-by-numbers design onto a blank canvas before painting. Next to nobody does either.
The really useful trick to databases, unlike spreadsheets, is that you, or somebody else, has to design the database structure and data entry rules before you begin entering. Data structure and data entry are separate in databases, giving them much greater flexibility than spreadsheets.
I’ve given up providing carefully validated and constrained Excel spreadsheet templates to undergraduate students. I’ve inevitably still got back a wild mix of data entry errors. I’ve also explained the pitfalls of spreadsheets to postgraduate students in their research methods class. Most still overconfidently fall into those same pitfalls the following year when they enter their thesis data into spreadsheets.
I’ve reached the conclusion, reinforced over many years now, that spreadsheets should not be used for data entry, except in the very simplest of cases. Like shopping list simple. Nothing else.
To help convince you, below I’ve collated a list of common problems I repeatedly encounter with spreadsheet data. Dealing with these have added days, to weeks, of time onto data analysis for postgraduate science students. Many would have been avoided by setting up and carefully using a properly constrained and validated spreadsheet template, but next to nobody does this. All would have been easily avoided by instead entering data into a database set up for the data.
Data death by sorting
Data that’s been arduously collected and meticulously entered into a spreadsheet can be killed in an instant with one careless sort. If you accidentally select and sort only part of the data, then save the file, you’ve broken the data. I’ve seen this happen often with students.
If you have to use spreadsheets, my advice is to enter your data into one golden master spreadsheet and save it, back it up, and keep it safe. Do all of your sorting and calculations and analyses in copies of this spreadsheet. That is, if you insist on doing your data summaries and calculations with a spreadsheet. You really should consider doing that with an app that reads but doesn’t alter your data, like R.
Otherwise use a database. Seriously. It’s impossible to kill your data with a sort in a database.
Anything, anywhere
The big appeal of spreadsheets is that you can open a new file and type anything, anywhere. People do, and that’s a problem.
To be useful for data analysis, your data needs to be a tightly structured grid of rows and columns of just your data. No gaps. No notes entered in a cell three columns to the right. No graph dropped next to a data column. No row of summary calculations inserted below every site throughout your data. No paragraph explanation of why a measurement failed, placed in cell part way down a column of measurements.
It’s far too easy in spreadsheets to do everything except make a simple, tightly structured grid of rows and columns of just your data. This is one of the big reasons why a rule of thumb for data analysis is 90% of the time cleaning the data and 10% of the time doing the analysis. That’s certainly been my experience analysing student data from spreadsheets. Most of that 90% of time is cleaning up all this avoidable spreadsheet goop from the data.
Fruit salad formatting in columns
For data analysis, each column needs to consistently contain one kind of data, for example, a column could contain just numbers, or just a set of categories, or just dates. Instead, the freedom of a blank spreadsheet lets you enter a wild mix of numbers, text, and question marks in any column.
Each column should be set up to do one job only. Setting up a database encourages this level of thinking about your data. Spreadsheets don’t, and almost inevitably that means a lot of wasted time reformatting spreadsheet data for analysis.
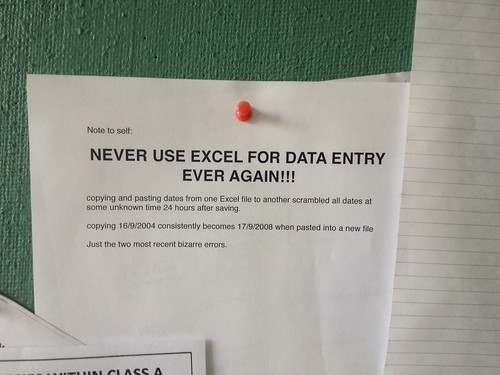
Scrambled dates
I permanently abandoned Excel when it irretrievably scrambled a date column in one of my datasets. That was over 15 years ago, and I still today have to wrestle with student spreadsheets with scrambled dates. In the best case scenario, they have to look back in their original hand written notes to retrieve the real dates.
As far as I can figure out, Excel still doesn’t store the dates you enter. It instead stores its interpretation of what you meant, as a number of days from a special start date. It then displays that stored value in a date format it thinks you’d like, or you can choose.
Different spreadsheets, and even older versions of Excel, can interpret these Excel stored “dates” differently, and then save them differently. This is all mind bogglingly dangerous when what you originally entered was never stored. Perhaps it would be tolerable if you planned on your data always staying inside the one version of Excel that you’re using, and being opened by no other computer app. That won’t be true if your data are of value to others.
One workaround that I recommend is entering dates in a format that spreadsheets don’t recognise as dates. That way they’ll store exactly what you enter, not what they think you mean. Entering “20181113” for “13 November 2019” does the trick nicely. Excel sees that as a number, not a date.
Or, of course, just use a database. That will store exactly the date text you enter, and display it in whatever date format you like, at the same time.
Auto-format wreckage, on by default
Date scrambling is just one of a group of auto-formatting features that are turned on by default in the big spreadsheet apps like Microsoft Excel and LibreOffice Calc. It can be diabolically tricky to figure out how to turn them all off.
The worst issue is numbers getting accidentally auto-formatted to dates then stored under the hood in the spreadsheet as a different number. Auto-capitalisation, auto-spell checking, auto-grammar corrections, and auto-curly quotes, can all wreck havoc with science-type data that the spreadsheet doesn’t recognise.
I get that the spreadsheet developers are trying to be helpful. Perhaps, in regular corporate business environments, these features really are helpful. However, for science data these auto-formatting features are stupidly dangerous and surprisingly complicated to disable.
If you’re using a spreadsheet, take the time to turn off as many of these features as you can. Otherwise set up a database that handles the entered data exactly how you want it to be entered.
Entering crud: typos, inconsistent capitalisation, and hanging spaces
There are these wonderful things called drop-down lists that let you pick just the value you want. Every time you pick a value, it will be formatted exactly the same. In data entry and data analysis, this consistency is an exceptionally useful thing.
Databases force you to think about this when you design your data structure and data entry form. Spreadsheets can also let you add drop down lists and other forms of data validation. Unlike databases, spreadsheets also let you get stuck right in and start entering data. Of course, that’s what most people do.
In my experience, most people using spreadsheets are too confident, and in too much of a rush, to bother setting up drop-down lists or adding data validation to columns. Then, inevitably, crud gets sprinkled into their data through overlooked data entry errors.
For example, a column of fruit in a database could allow the unique values “apple”, “banana”, “orange”, and “mango”. An equivalent column in a poorly set-up spreadsheet could easily end up with values like “apple “, “Apple”, “Bananas”, “ orange “, or “Mango “. That’s without the added mis-spellings that crop up in large spreadsheets. Before analysis, all of these values would need to get translated back to one of “apple”, “banana”, “orange”, and “mango”. In spreadsheets with many rows and columns, this translates into lots of wasted time.
If you don’t take the time to set up drop-down lists or add data validation to columns to spreadsheets, you really shouldn’t be using spreadsheets.
Contradictory values in duplicate data
It seems that most people find it easier to enter the same information multiple times into a spreadsheet, rather than set up several worksheets to enter all information only once.
For example, your data might have the columns “date”, “time”, “site”, “temperature”, “butterfly species”, and “count”. (You’d probably also want columns about butterfly sex, life stage, what flower was being visited, etc. but I’ll skip that complexity here.) With this structure, whenever you counted more than one species of butterfly at a site, you would add that many extra rows to your spreadsheet. Count two butterflies, add two rows.
The problem here is with “date”, “time”, “site”, and “temperature”. To keep your spreadsheet complete, you’d have to enter the same values for these on each row. The danger is accidentally entering contradictory values.
Say you’ve counted nine butterfly species at a site, and entered nine rows, one for each. You also enter the same temperature value nine times. While checking your data entry, you notice you’ve made a mistake and you correct the temperature. You accidentally only correct eight of the nine duplicate values. Now your data contains two contradictory temperature values for one survey.
That’s how contradictory values get into spreadsheets. If you give someone your spreadsheet to analyse, they won’t know which of the two temperature values was the correct one for that date, time, and site. The only way to recover that would be for them to ask you and for you to look it up in your original notes (if you have them).
The danger of contradictory values is avoided by only entering each value once. Doing that requires using multiple worksheets in a spreadsheet. In this example, you’d have two worksheets. One would contain the columns “survey_id”, “date”, “time”, and “temperature”. The other would contain “survey_id”, “butterfly species”, and “count”. Each survey you did would have its own unique “survey_id” value that connects the two worksheets.
Entering into multiple worksheets like this, while absolutely the right thing to do, is clunky and inelegant. Most people don’t do it. They want to see all their counts together in one place.
Databases do both at the same time, elegantly. In a database, the structure of the data does not need to be the same as the way it is displayed on the data entry form. It’s easy to set up two related tables with the same structure as our two butterfly worksheets, but display all of the fields on the same one form for data entry and display.
Comments everywhere
Comments are welcome in data, but please always keep them separate from your columns of numbers and category values. Since spreadsheets are so freeform and unstructured, people can type comments anywhere. That’s what we do.
I see explanatory comments mixed in with counts in count columns. I see written explanations of missing times in columns with time data. I see little Excel-specific pop-up comments on cells that get lost when the data is exported to another app for analysis.
Cleaning up comments everywhere is one of the big time wasting steps when analysing spreadsheet data. If you have comments to make in a spreadsheet, make separate columns for comments and put them there and only there. Always.
A properly set-up database wouldn’t let you litter the data with comments. Instead, you have to design the database to make appropriate places to put comments.
Data in bold, data in colours
There are a lot of formatting options to make a spreadsheet look pretty. Fonts can be changed. Cells can be coloured. This is all fine. The temptation is then to use these features to annotate your data.
For example, I sometimes see information entered only by the cell colour. The green cells might be the garden sites and the yellow cells the farm sites. That’s fine if there’s also a column containing “garden” and “farm”. If there’s not, that’s bad.
Colour and formatting are awkward for other apps to understand and don’t reliably export out of spreadsheets into analysis apps. By all means use colour and formatting for emphasis on your spreadsheet. Never use it as the sole way of entering information.
As you’ll have guessed, this doesn’t happen with databases because the data structure and data display are separated.
Sorry ‘mam, text only
Modern databases can accept and store and display pretty much any kind of data, including photos, videos, sound recordings, and PDF files. Spreadsheets, not so much. Using a spreadsheet leads to a fragmentation of project files that take a lot of care to curate. People in too much of a rush to use spreadsheets carefully also aren’t always the best at carefully organising the files they’re unable to store in their spreadsheet.
Freeze, if you know how
If you know how to use a spreadsheet, you’ll have figured out how to freeze header rows and columns. This lets you see these headers at all times while you scroll through a spreadsheet and enter data.
I’m surprised by how many people don’t know about this and yet still enter data into spreadsheets. This risks data being entered into the wrong columns in a large spreadsheet because the column labels aren’t visible.
If you use a database, the labels are included in the data entry form, along with whatever other helpful tips you want to add.
Have your cake and analyse it too
Modern spreadsheet apps, like Excel and LibreOffice, have a lot of bells and whistles added that let you graph and analyse data. People have come to expect that they can do anything within their spreadsheets. As with data entry, this freedom to do anything comes with the risk of breaking data.
I already mentioned the scary ability to scramble spreadsheet data with a single poorly performed sort. When you add on lots of calculations and graphs and stats, the probability of accidentally damaging your original data goes up.
The best practise here is to keep your golden master data spreadsheet separate from all your calculations, analyses, and graphing. If you must use a spreadsheet, do all of those manipulations with a copy of your file. Better yet, use an app like R that can non-destructively read your spreadsheet data and do anything you can dream of with it.
This separation of data storage and data visualisation and analysis are much more well defined with databases.
Spreadsheets are my only hope! No, there is another
Welcome to the future. It’s the year 2000. Spreadsheets are now obsolete and have been replaced by much more flexible, feature rich, and robust databases. Oddly, that’s what did happen. Sort of. The databases are here and yet it’s now 2019, and most people are still stuck in the 1990s using their vintage spreadsheets. It’s the technology equivalent of Groundhog Day (or Edge of Tomorrow).
What databases could you be using instead of your spreadsheet? Part of people’s over-reliance on spreadsheets seems to stem from their lack of awareness of other options (and their IT departments’ devotion to Microsoft Office). However, databases are everywhere. They’re just so diverse in their user interfaces that most people don’t notice they’re there.
Database front ends are infinitely more flexible than a spreadsheet, and that makes them easy to overlook. Databases power just about every website you visit and every mobile app you use. Every time you fill in a web form or search a website, you’re using the front end of a database. You’re using a database every time you add observations to iNaturalist or eBird. This incredible flexibility is because databases separate the data storage back end from the user interface front end.
There are many great products that let you quickly set up a personal database, both back end and front end, for your data entry. KoboToolbox is a great solution for setting up mobile data entry solutions. Google Forms is a simple, flexible option for simple data structures. LibreOffice (the free, open-source alternative to Microsoft Office) contains a spreadsheet app, Calc, but also Base, a feature-rich database that’s well worth learning to use. There are also some nice commercial database options, like Fulcrum, TapForms, Airtable, and FileMaker. And, there’s Microsoft Access.
Perhaps you’re stuck with using spreadsheets. In some institutions, IT departments have the computers so locked down that staff are stuck trying to do everything with the base version of Microsoft Office 365. If that’s you, my commiserations, and please use your spreadsheets carefully and mimic a database as much as you can. That means always setting up data validation and drop-down lists before starting data entry. It also means turning off all auto-formatting, and using multiple worksheets to prevent data duplication. Be sure to keep your precious entered data in a separate file from the one you use for sorting, calculations, and graphs.
Everyone with a choice should take the time to set up and use databases. If your data is worth collecting, it’s worth a little time to design a good data entry interface, connected to robust data storage. The little bit of extra time and care at the start will save you time in the long-run, and make it much less likely that’s you’ll lose data in a formatting accident.