RECENT ARTICLES
- CEBRA: An optimised and standardised sampling protocol for BioBlitz
- Stop it people, the plural of anecdote IS data!
- That's no pollinator, that's a flower visitor
- Add a scale to your macro photos
- What to photograph when counting the wild
- Imagine counting the wild on EVERY street in a city!
- My wild counting workflow
- A butterfly flew through
- Why iNaturalist observations without photos can be research grade
- Why you shouldn’t use a spreadsheet for data entry
- All articles ...
So, you want to start a trend.
Here are options, from simple to more complicated, for collecting nature observations in ways that will reveal robust trends over time.
written Oct 9, 2018 • by jonsullivan • Category: Wild Counting

There are different ways you can count the wild to reveal long term trends in nature. Some are easy and simple. Others have all the whistles and bells attached, requiring lots of money, time, and/or expertise.
In this article I focus on some simple and easy ways you can make wild counts that can reveal long term trends. We’ll start with the worst options and move up.
Count whatever you like, whenever you like
It’s very hard, but not impossible, to extract plausible trends from large numbers of casual observations. These are haphazard observations made when something catches someone’s interest. Natural history museums and herbaria have collected these kinds of observations for centuries. They form the foundation of our knowledge of the world’s biodiversity. Online communities of nature observers like iNaturalist now collect millions of these casual observations.
It makes intuitive sense that if a species increases in abundance, so should the number of casual observations, and vice versa. Unfortunately, it’s not nearly that simple. For example, people don’t often record observations of very common species. They’re instead attracted to the rare and unusual. Once they’ve made an observation of an unusual thing, they might never bother to record another observation of it.
Also, what interests people enough to record an observation is influenced by a lot more than a species’ abundance in nature. Changing human demographics and culture, such as through ageing and immigration, can alone change what is observed. Just one popular TV show or movie could create a spike in observations when a species becomes more popular.
A complex morass of assumptions about collector behaviours are needed to attempt to infer trends from collections of casual observations. The statistics are difficult and the conclusions are unavoidably tentative. That’s not to say that this effort is not worthwhile. Many of the possible trends that can be uncovered with this approach will be previously unknown and warrant a more careful look.
Regardless, if you’re interested in making sure that your observations reveal real trends in the wild, then it’s vastly better to add some consistency to your counting.
Comparing anecdotes
Before we start counting, it’s also worth mentioning a simple, if inaccurate, approach that doesn’t involve any counting at all. We ask people whether they think prominent species in their area have gotten more or less abundant, or have not changed. For example, this is a question asked in New Zealand’s annual Great Kereru Count (alongside real counting).
The assumption is that in areas where most people think a species is increasing, it’s probably increasing, and where most people think it’s in decline, then it’s probably declining. If the answers shift over time, then it’s assumed that the abundance of the species is probably changing too.
This can be simple to do—-it’s relatively easy to reach a lot of people in this age of social media and citizen science—-but it’s unlikely to be particularly reliable at detecting anything but the biggest trends. Human brains are notoriously bad at detecting gradual changes in their environments. Also, as any good marketer or political campaigner knows, people’s perceptions are influenced by a great many things besides reality.
If you’re already surveying people, these can be interesting questions to ask and track over time. However, if you specifically want to know how wild species are trending, it’s better to count.
Relative counts
A simple approach with some counting is to record every time you see an individual of a selected group of species. The group of species you select should contain species that occur in the same habitats and are connected to each other in some way (e.g., they’re closely related, or compete with each other, or eat the same foods). It works best if this is a small group of readily detected and easily identified species, none of which are distractingly abundant.
I use this approach in southern New Zealand with ladybirds and praying mantises, neither of which I see particularly often where I live. For many years now, I’ve noted down, and identified, every one I see (with date, time, location, plus a photo if I’m not 100% sure of my identification).
Such haphazard observations alone are not sufficient to reveal anything but massive changes in the abundance of individual species. However, it’s a safe assumption that my relative ability to detect the different species in a group won’t change. In other words, some species are easier to find than others (for example, the bigger, more colourful, and more active), and that won’t change over time.
With my relative counts, I can reliably detect proportional changes in species over time. For example, are the most common ladybirds now different from five years ago? Are native ladybirds becoming proportionally less common over time? Is that happening everywhere or just in some places? How is that affected by the arrival of a new ladybird predator? All these trends can be revealed with relative counts.
Turning relative counts into trends in abundance for each species requires the assumption that our collecting effort hasn’t changed over time. That’s a big assumption that could easily be false. For example, my ladybird counts might increase if I work on a job that has me spending more time outside in the heat of the day. Or, I might see more ladybirds over time because I get better at finding them, not because they’re getting more abundant
To make a robust index of abundance per species, I’d also need to record my observation effort. At its simplest, that’s consistently recording where, when and how hard I looked, regardless of whether or not I found anything. I do that too, but it’s a step up in effort and dedication. We’ll talk about that in the next section.
Regardless, even without making this extra effort, relative counts can reveal proportional changes in species that nobody else has documented. It’s simple to do and useful.
Today I found
To reveal trends in a species’ occupancy or abundance, we have to record our observation effort in some way. That’s means consistently recording What-Where-When-Who-Why-How. These are the essentials of wild counting and other biodiversity surveying. One of the simplest suitable methods I’ve thought of that ticks all these boxes for mobile species like birds and butterflies is what I call “Today I found”.
Pick one (or a few) local species you’d like to consistently record (the What), that you’re interested in revealing trends for (the Why). Pick one, or a few, places that you’re often at, such as your home (the Where).
At the end of each day, note down how many hours you could have noticed your species, had they been there (the When). That could be how many hours you were in your garden. Or, for noisy birds, it could have been how many hours you were home either outside or inside with a window open.
The How is how you find your species. You just need to write that down on your first day, and stick with it. For example, if it’s a bird, you should write down if you consistently record it when you hear it calling or singing, or just when you see it.
If you’re the only observer, the Who is you. If other people help you, they get to be the Who too.
At its simplest you can then just record the daily presence or absence of the species at your place(s) (yes or no, I found it or I didn’t). Keep doing that day after day and trends will soon emerge, first seasonal and then annual. Recruit your friends and others to join in and you’ll soon know a lot about how your species is trending.
If you’re extra keen, or your species are easy to count, you could also make a conservative daily count of how many individuals of that species you saw or heard. The safest way to do that, since individuals will come and go through the day, is to record the maximum number of individuals you observed together at one time.
This is a simple habit to get into. The key is being consistent in always recording the When, even on days when you don’t see any of your species, and be diligent not to change the How.
Rinse, repeat, and watch the trends emerge.
The bells and whistles
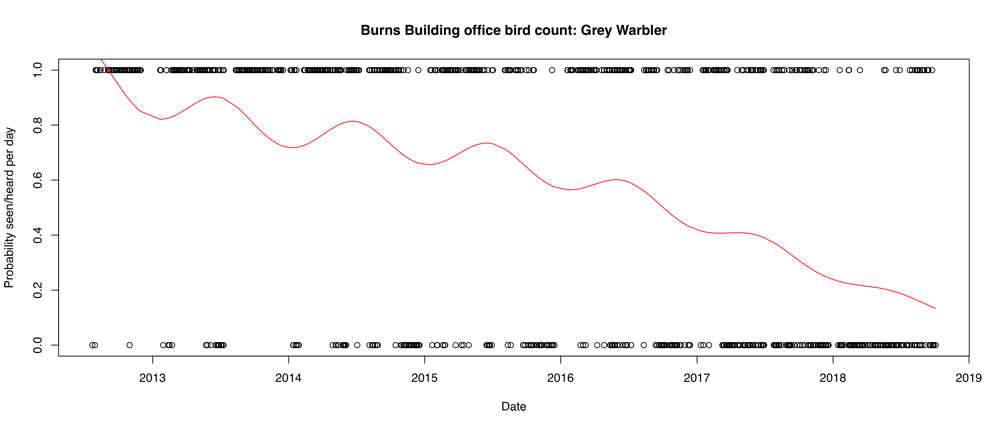
Welcome to the top of the slippery slope of wild counting. The essentials of What-Where-When-Who-Why-How can be elaborated on to count much more of the wild, much more frequently. I now use a Filemaker Go app on my iPhone to count the wild everywhere I go. I’m even doing it right now, while I write this, using an expanded version of “Today I found” that breaks my day into consecutive 20 minute intervals. My office window is open, and I’m noting down any native forest birds I hear or see, or butterflies I see, in each interval. I’ve been doing that for many years, from work and from home (for example, here’s the first seven years of doing it from my work office).
There are more detals about my complete Wild Counts method elsewhere on this website. What’s important is that you don’t need to start with a jump into the deep end. There are also simpler, consistent ways to count the wild to reveal trends in nature.
Here comes high tech
Technology is also introducing increasingly powerful and automated systems for counting the wild using cameras and microphones connected to image and audio recognition software. Those solutions, alongside environmental DNA molecular methods, are still expensive and technical, but their day is coming fast.
Start a trend
For almost all wild species, we don’t know how they’re trending over time. Some of these species are easy to find and identify. Figuring out how they’re trending at sites is easy to do. It just needs your long-term commitment to make consistent observations. “Today I found” is often good enough. It’s one of those things where one person, or one school classroom, or one scout troop, with very little effort, sustained over time, can make a big contribution to the local knowledge of a wild species.
Counting the wild to reveal trends can be simple and rewarding. If lots of us do it, and share our counts, we’ll collectively open our eyes to how the diversity of wild nature is changing. Let’s start our own trend and collectively make the wild count.