RECENT ARTICLES
- CEBRA: An optimised and standardised sampling protocol for BioBlitz
- Stop it people, the plural of anecdote IS data!
- That's no pollinator, that's a flower visitor
- Add a scale to your macro photos
- What to photograph when counting the wild
- Imagine counting the wild on EVERY street in a city!
- My wild counting workflow
- A butterfly flew through
- Why iNaturalist observations without photos can be research grade
- Why you shouldn’t use a spreadsheet for data entry
- All articles ...
Go beyond species lists in your surveys and BioBlitzes. Tweak Two: subdivide your effort
One of four tweaks to surveys and BioBlitzes that make them useful for long-term monitoring.
written Jun 10, 2018 • by jonsullivan • Category: Wild Counting

This article is one in a series about four simple tweaks you can make to your surveys and BioBlitz events that will make them much more useful for long-term monitoring.
Tweak One: document your effort
Tweak Two: subdivide your effort
Tweak Three: how much did you overlook?
Tweak Four: how often did you misidentify?
Tweak Two: subdivide your effort
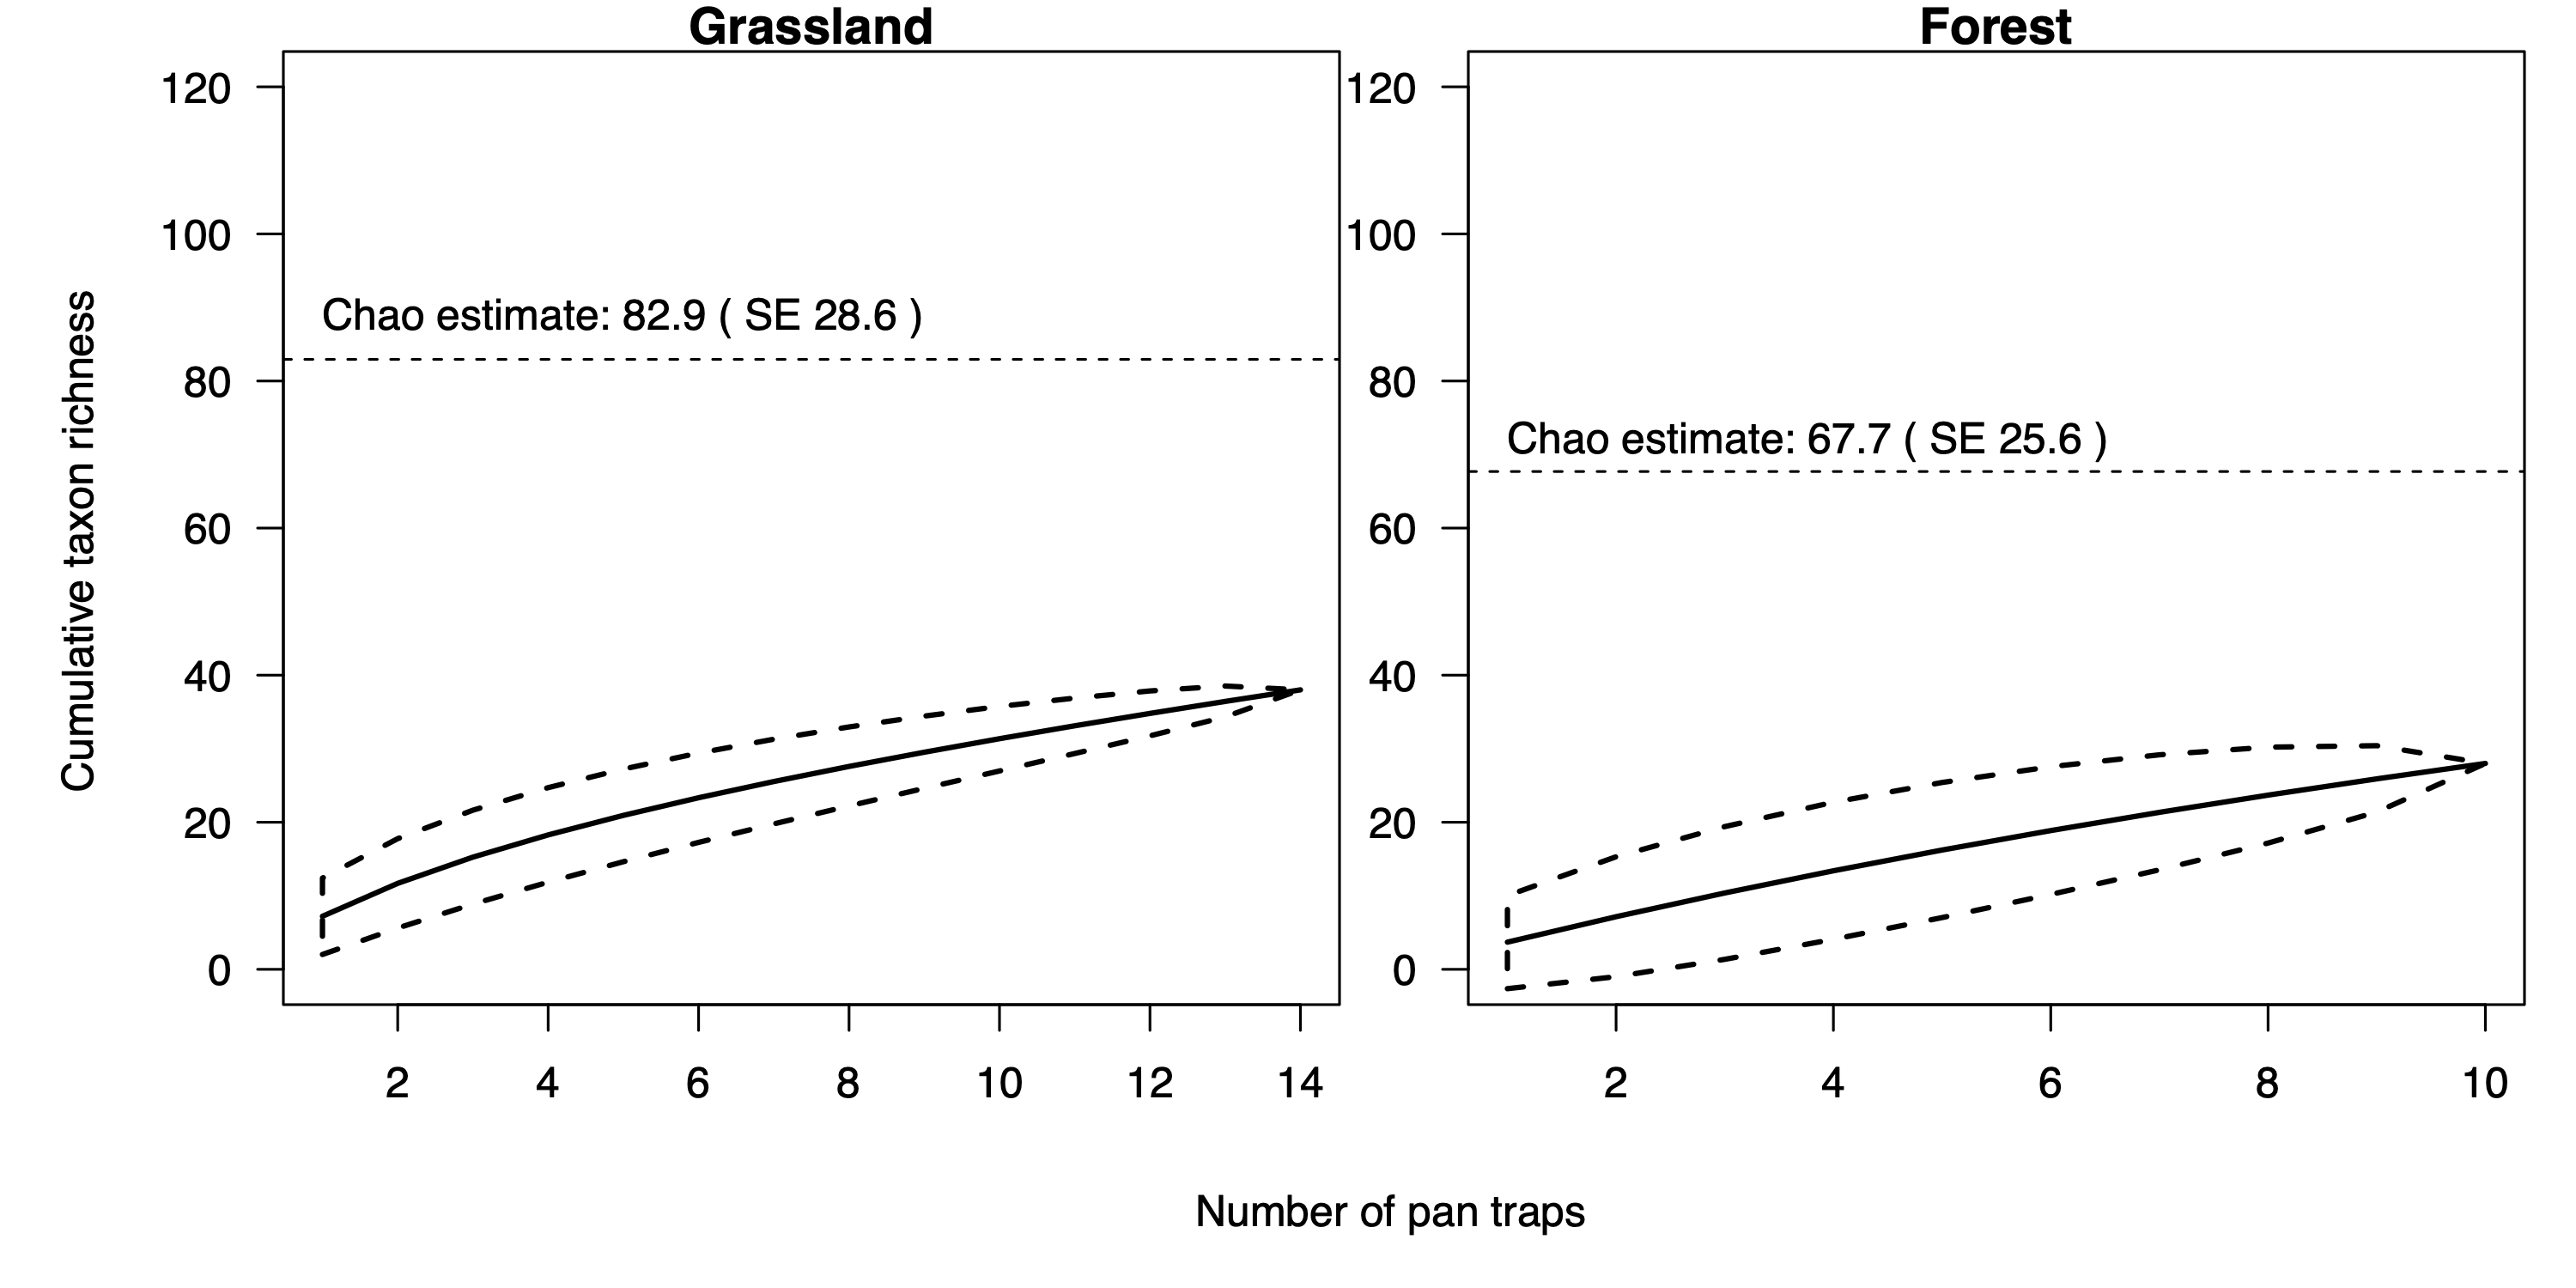
It’s fantastically useful to subdivide your survey into many short units of equivalent search effort. They can be short units of distance, if moving, or short durations of time, if stationary. Plant ecologists typically sample by repeating standard-area plots (quadrats) and transects. Bird experts typically repeat standing still at different places for a standard amount of time.
The further you travel, and the longer you wait, and the harder you look, the more species you will encounter. By recording all the species you find per unit effort, you (or others) can calculate exactly how many more species you encounter which each unit of effort you add. This makes what ecologists call a species accumulation curve. As you put in more effort, you accumulate more species. With that curve, ecologists can estimate the exact proportion of all the species at a site that you have found. Knowing that is extraordinarily useful for future repeat surveys.
By subdividing your recording into lots of short units of effort, you get both a species list and a robust and repeatable record of which species are most common and where they’re found across your site. Admittedly, surveying in this way can be a little slower than just rambling about. However, the advantages easily outweigh the cost of covering a little less ground.
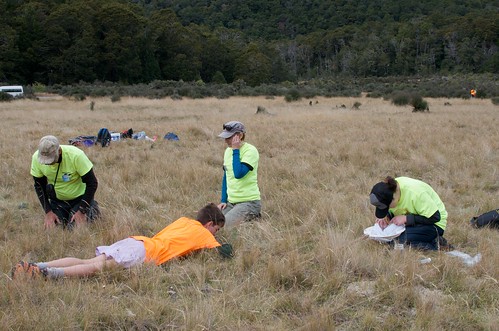
In a hectic BioBlitz event, you can subdivide effort by sending out small teams from base camp to search for a set amount of time (eg 20 minutes) and get them to GPS where they go. If they want to search for longer, then they can come back to base camp, report what they found, then head out again for another 20 minutes. You can also mark out standard-sized plots ahead of time (eg 20 m by 20 m) and give people the challenge of finding as many species as they can in those plots. Both methods work well, and I’ve used both in what we’ve called EcoBlitz events here in New Zealand.
If you’re a professional working alone, or in a small team, then the best method for subdividing effort will depend on the taxonomic richness and ease of detection of the species group(s) you’re surveying. For example, if you’re doing all vascular plants, then you should survey transects or quadrats along your route. If you’re looking for a smaller subset of easily noticeable plants, or other such species, then I find subdividing a route into lots of 10 metre long sections works well (which I approximate with 10 paces). If you’re doing birds, you can repeat set-length slow walk transects and repeat stationary counts. That way you can record all the time you are at a location to increase your chances of finding the rarer birds.
Getting a GPS location for each of your survey units greatly expands the options for people repeating your survey in the future, and for both researchers answering questions using of your data.
It’s good to randomise the locations of your survey units as much as you can. Randomising lets ecologists use statistics to generalise your results to the whole site. In practise, this is usually constrained by logistics and site accessibility and safety, in which case randomise where you can and describe your contraints.