How to document patterns and reveal trends in your wild counts.
written May 21, 2018 (last updated Oct 29, 2023) • by Jon Sullivan • Category: Data Wrangling
The data pages of WildCounts are currently in development.
Turn wild counts into knowledge
When nature observations are made consistently, with all the What-Where-When-Who-Why-How information, then it becomes much simpler to document patterns and reveal trends in the data.
I won’t publish data analysis code until the WildCounts data format has been updated to be compliant with the Darwin Core standard for biodiversity collection data and the new Humboldt Core standard for ecological survey data. In the meantime, here are some examples of the patterns and trends that can be seen from my 20-years of personal wild counts. All were produced with the free, open-source apps R and QGIS.
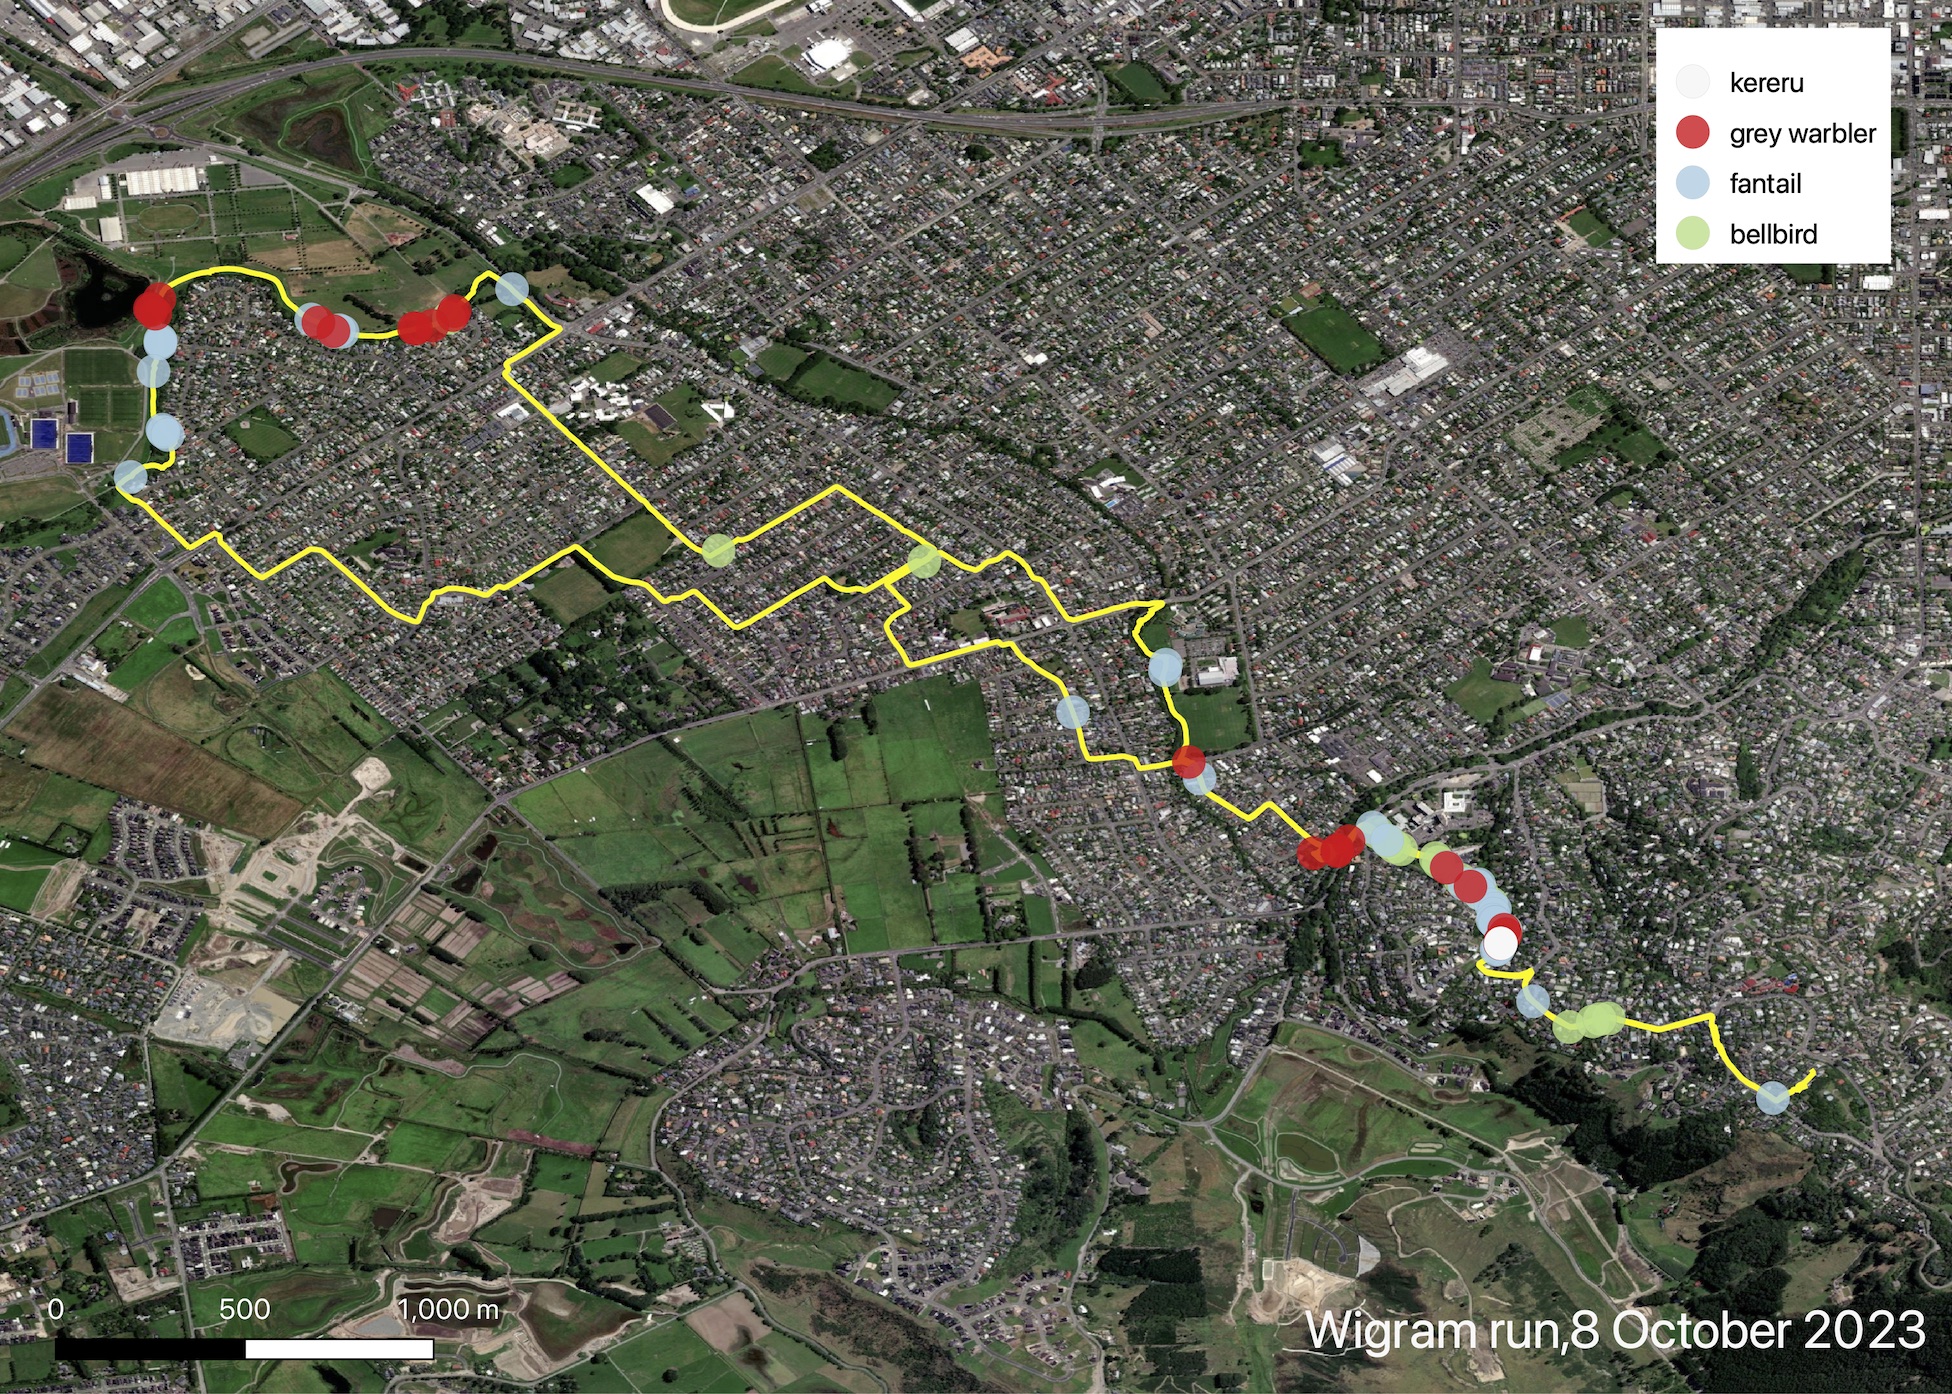
Here are the native New Zealand forest birds I counted along my weekly wild counts run, in this case my Wigram route through the southwestern suburbs of Ōtautahi-Christchurch city, on 8 October 2023. The data were spoken into my iPhone in WildCounts Spoken format, transcribed later that day with AWS Transcribe, checked, then imported as a spreadsheet into QGIS to make this map.
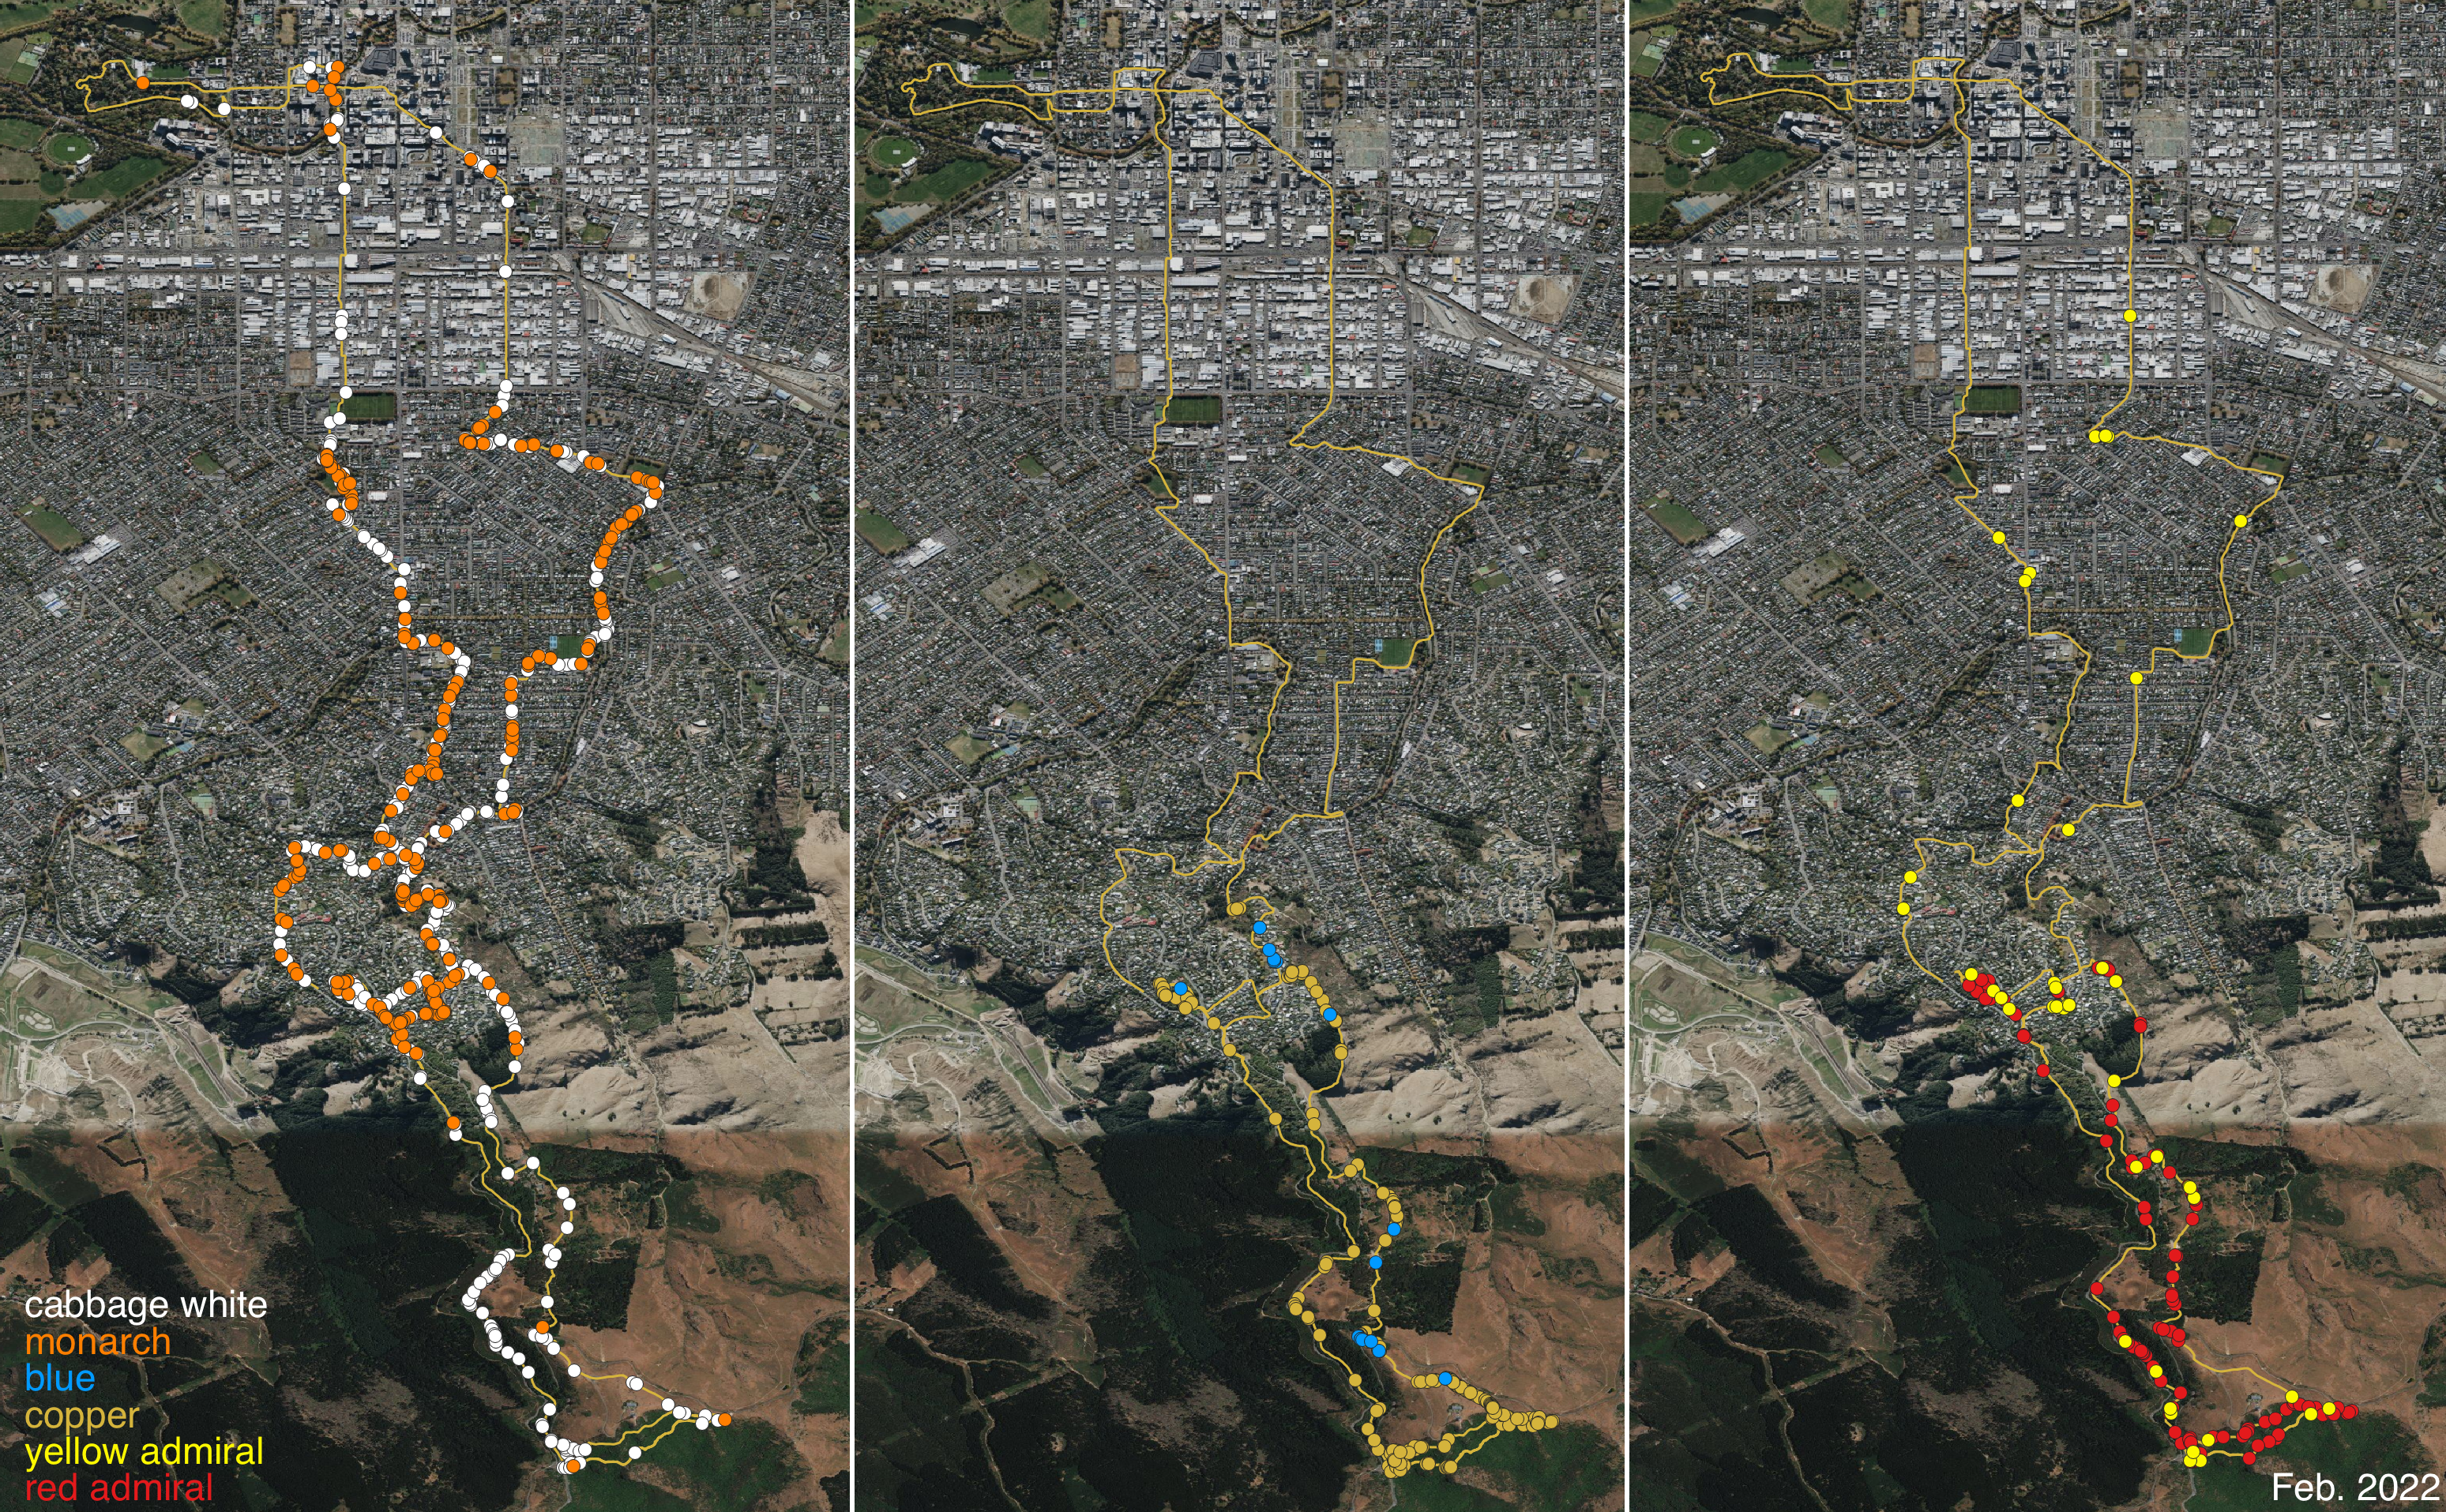
Here are all the butterflies I counted along two monthly wild counts runs, one into the city and one into the hills, at Ōtautahi-Christchurch city, NZ, in February 2022. The two runs combined are 32 km. The data were spoken into my iPhone in WildCounts Spoken format, transcribed later that day with AWS Transcribe, checked, then imported as a spreadsheet into QGIS to make this map. Here I've combined three QGIS maps into one image. The cabbage white, Pieris rapae, and monarch butterfly, Danaus plexippus, are introduced species, while the others are native. The blue is Zizina oxleyi, the coppers combine two species on the map, Lycaena sp. "Canterbury winter copper" and Lycaena feredayi, the yellow admiral is Vanessa itea, and the red admiral, or kahukura, is Vanessa gonerilla. Introduced butterflies dominate in the built city and native butterflies dominate in the hills.
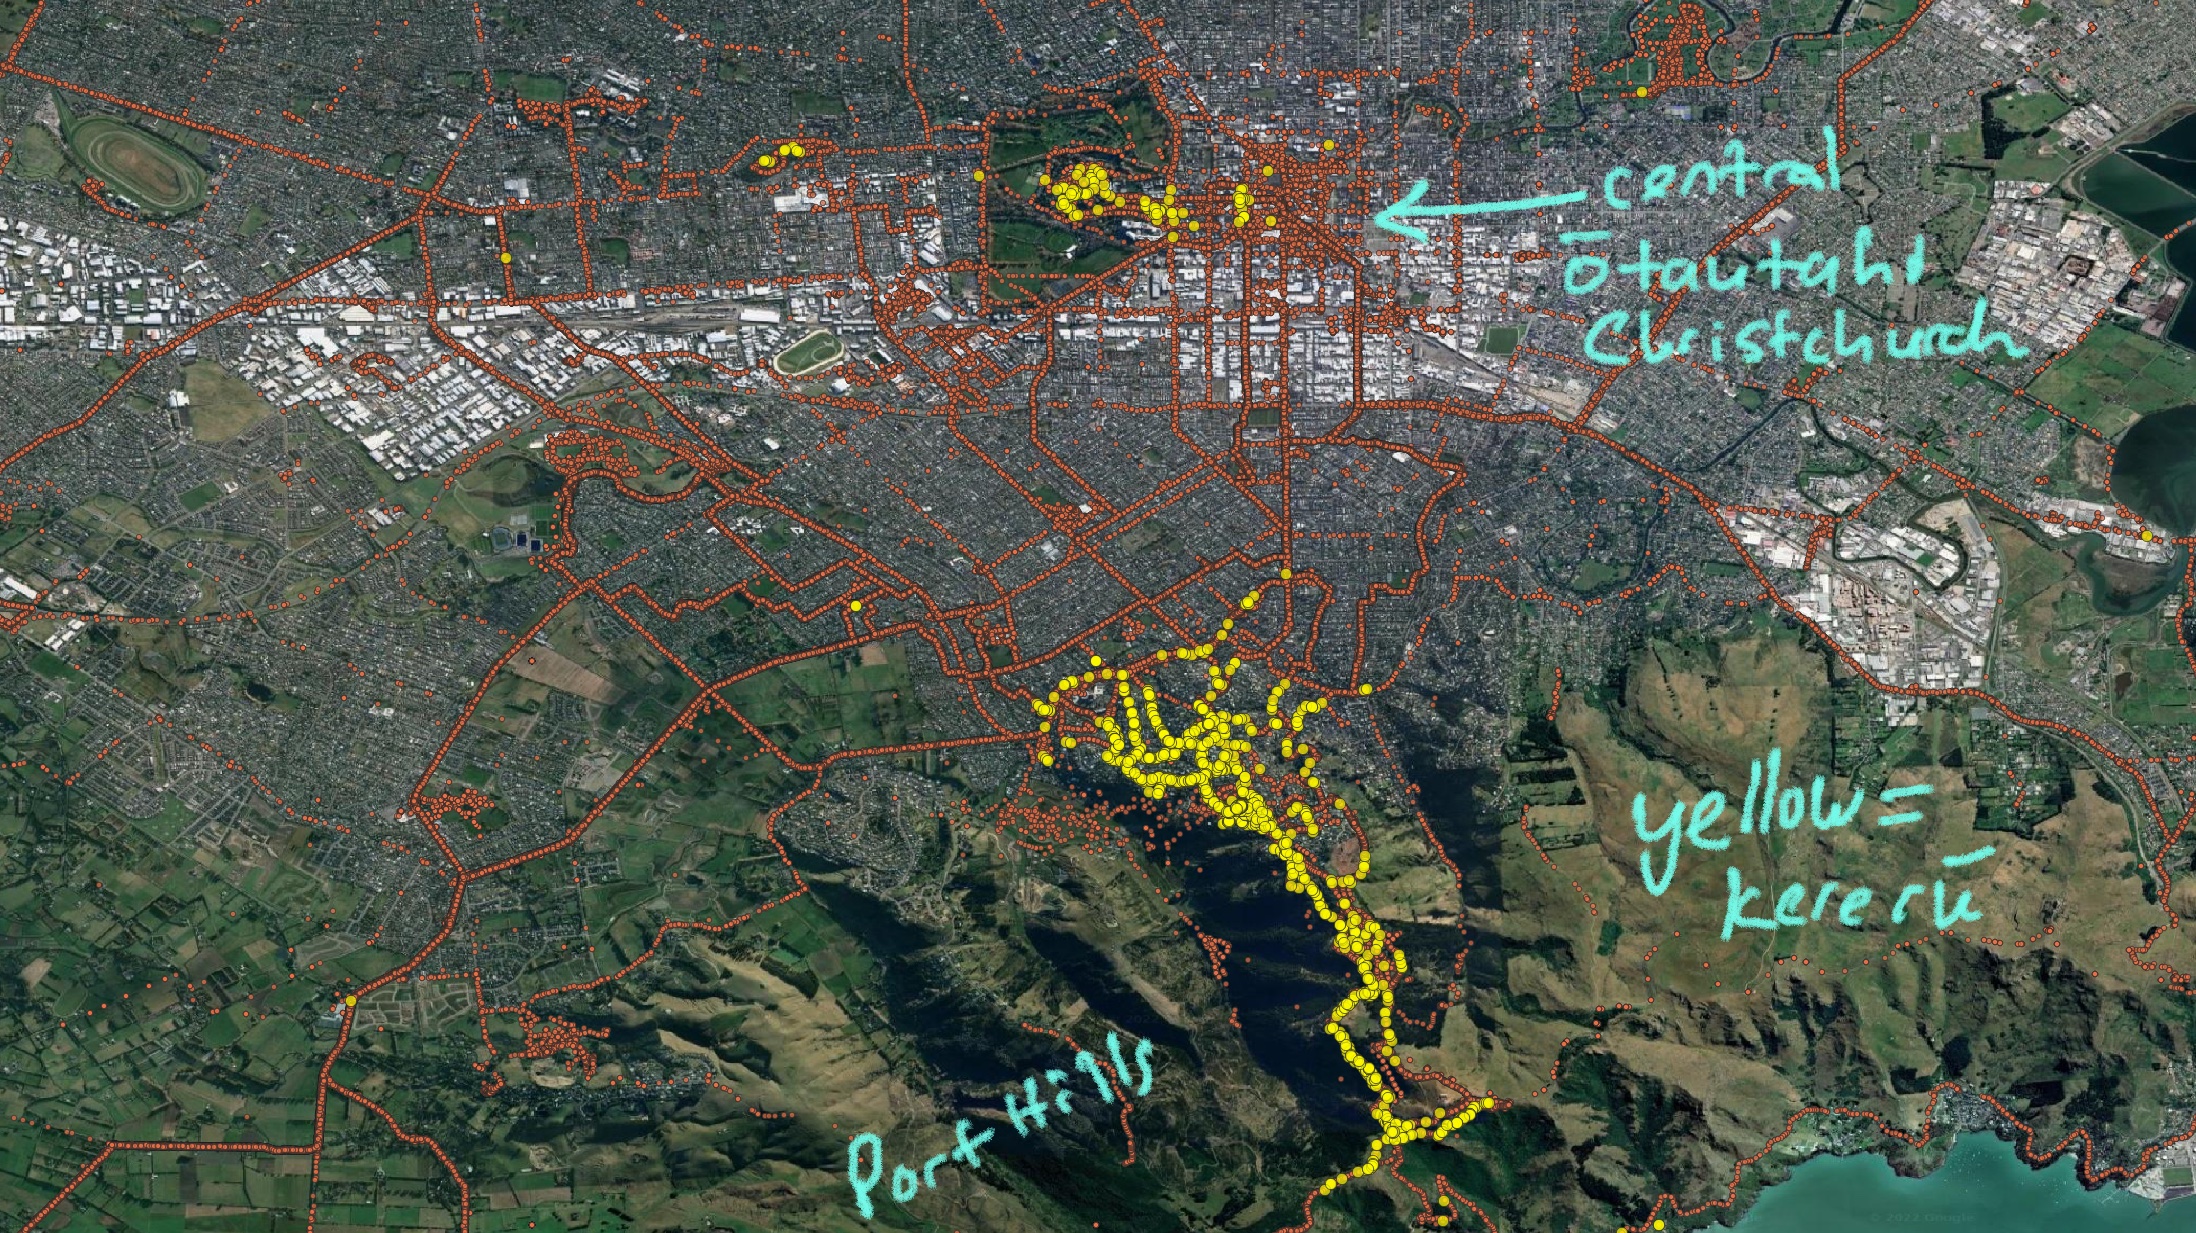
Here is an annotated map from QGIS of all the places I have ever made wild counts around my home city of Ōtautahi-Christchurch, New Zealand, and everywhere I have ever seen, and counted, kererū/NZ wood pigeons. By consistently recording all my wild counts, regardless of whether or not I see my predetermined species, I can map out not just where the species are found but also, importantly, where they are not found. In this case, kererū live in the forest reserves and adjacent suburbs of the city hills, and are also found in the old planted native forest in the city's botanic gardens in the middle of the city, and in a nearby old growth forest remnant to the west of the central city. Most of the suburban city is a kererū desert.
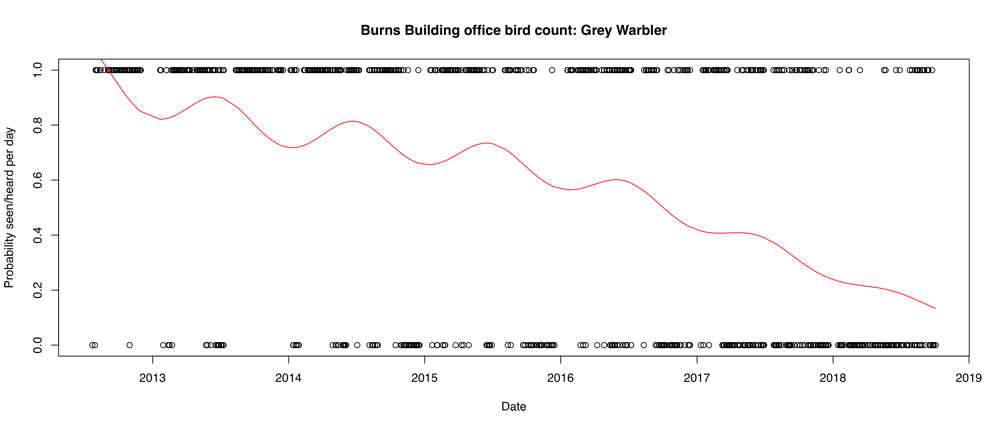
This graph shows when I saw or heard riroriro/NZ grey warblers from my office at Lincoln University, New Zealand. Every 1 is a day where I saw or heard this species, and every 0 is a day when I didn't. Fitting a binomial generalised linear model to these data shows that there has been an ongoing decline in grey warblers, with more birds observed in winter than summer months. Counts like this are very simple to make, and often reveal trends that nobody has noticed.