RECENT ARTICLES
- CEBRA: An optimised and standardised sampling protocol for BioBlitz
- Stop it people, the plural of anecdote IS data!
- That's no pollinator, that's a flower visitor
- Add a scale to your macro photos
- What to photograph when counting the wild
- Imagine counting the wild on EVERY street in a city!
- My wild counting workflow
- A butterfly flew through
- Why iNaturalist observations without photos can be research grade
- Why you shouldn’t use a spreadsheet for data entry
- All articles ...
Counting birds in real time
A rapid method for transcribing all birds seen and heard on the go
written Jan 1, 2013 • by Jon Sullivan • Category: Wild Counting
There’s something satisfyingly self contained about an anecdote. “We used to have tui in our Christchurch garden back in the 1970s.” “That’s the first bellbird I’ve ever seen in our garden.” Anecdotes like these are just single sentences from much bigger stories of changes happening to nature. Telling these stories in detail requires a lot more frequent and consistent recording across many sites.
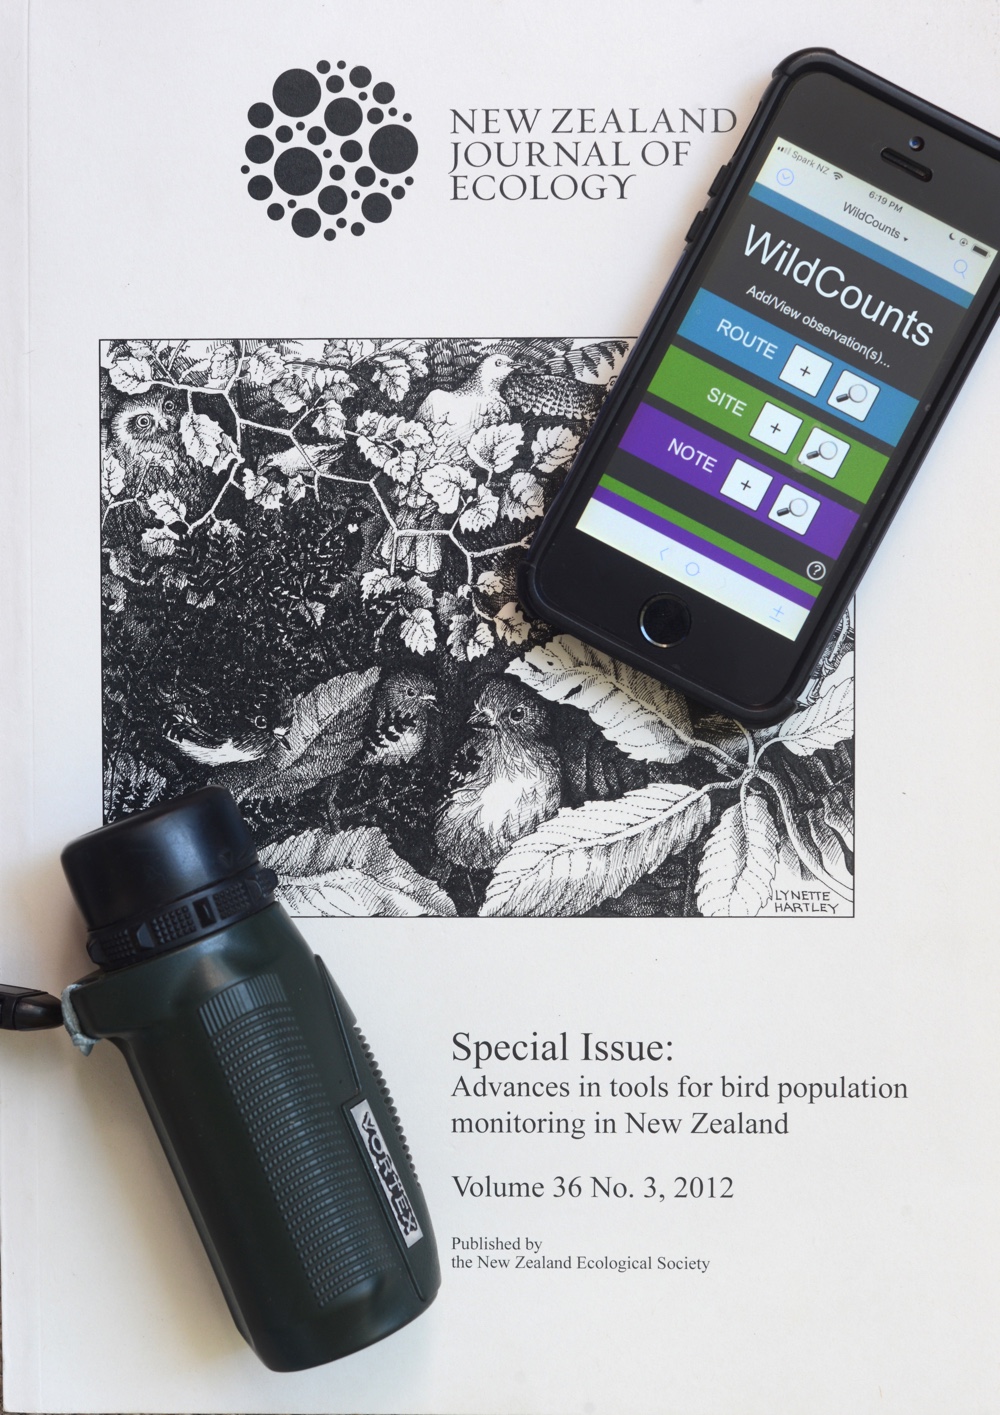
In 2012 I published a paper in the New Zealand Journal of Ecology called “Recording birds in real time: a convenient method for frequent bird recording”. In it, I introduced my personal method of recording birds, which I also use for butterflies and selected other species. My motivation was to make a method simple enough to do all the time, and to become habit forming, while still containing the essentials of solid ecological monitoring.
People are changing the world rapidly. To understand how nature is responding, more than anything, we need lots of observations.
Much has already been written about bird recording methods, internationally and in New Zealand, including the useful 2005 report edited by Eric Spurr called “Monitoring bird populations in New Zealand: a workshop to assess the feasibility of a national bird population monitoring scheme.” It includes a detailed summary of one of the most commonly applied methods used by professional ornithologists (birders) in New Zealand: the five minute bird count (5MBC). The five minute period is kept purposefully brief to minimise the chances of double counting birds.
A five-minute bird count is about as simple (and as tricky) as it sounds. The big trick is knowing your birds well enough to count them all. Ornithologists count all bird species in five minutes; that takes a substantial amount of skill and experience in habitats like forests where most birds are heard but not seen.
If bird densities are to be estimated at each site, they’ve also got to estimate the distance to each bird in the five minutes. This “distance sampling” allows a statistician to estimate how the chances of seeing or hearing a bird of a particular species declines with distance, and to use this calibration to convert bird counts into estimates of bird densities.
There is also a mobile equivalent of a five minute bird count called a slow walk transect. You walk a line, slowly, recording all of the birds you see or hear. Again, distance sampling is optional but allows densities to be estimated from your counts.
Both survey methods are typically repeated at the same sites at least a few months apart to gradually reveal trends in overall bird numbers. Keeping each count months apart reduces the chances of counting the same birds time and again.
There are a some recognised disadvantages of doing five-minute bird counts (or infrequently walked transects), with or without distance sampling, at a few sites every few months. Chief among them is the problem with rare birds. For example, a few five-minute bird counts are not going to document the probability of seeing a kererū (New Zealand’s native wood pigeon) on New Zealand’s deforested Canterbury Plains, nor detect whether their low numbers here are trending up or down.
Since most native forest birds are uncommon to rare (to absent) in most of New Zealand’s urban and rural landscapes, a sparse and infrequently repeated grid of five-minute bird count stations is not going to detect many of them. What we need is much more frequent and longer duration observations, preferably at lots of sites.
Also, few people want to count every house sparrow they see while waiting for that rare kererū sighting, but they may still be happy to note every kererū that visits their garden. Still, just noting all your kererū sightings is not enough. Calculating a trend from occasional kererū sightings requires knowing all the places and times where and when you were looking but didn’t see any kererū.
I wanted to get quantitative information on the chances of seeing native forest birds across Christchurch and the Canterbury Plains, where I live and work. To do this, I realised I had to abandon the notion of using infrequent short pre-determined recording intervals. Instead, I could record all the time wherever I went. In other words, I could do a census rather than a sample of all the kererū I saw in my life. So that’s what I’ve been doing.
To make this practical, I started by focusing on just on the species I was interested in. For birds, that was the native forest birds that were in the wider Christchurch area before the city was founded. While birders like to survey all the birds at a site, there’s nothing ecologically meaningful I can see about surveying all birds. Duck numbers will be influenced by the amount water and the abundance of water weeds and aquatic invertebrates, not how many kererū there are perched in the trees. Kererū will be influenced by whether or not local trees are fruiting, not how many ducks there are in the river.
It’s therefore much more important, when kererū are the focus, to survey fruiting status of trees than count all birds. This meant that I could start surveying kererū without being a skilled enough birder to tell a redpoll call from a greenfinch call, or be intensely focused on detecting and identifying every bird species present.
I also dropped the requirement of estimating the distance to each bird in favour of a few distance bands, eventually settling on close (≤ 5m), near (> 5 m to ≤ 20m), mid (> 20 m to ≤ 80m), far (> 80 m to ≤ 320 m, approximately), and distant (> 320 m). (I also started with near-in, > 5 m to ≤ 10 m, and near-out, > 10 m to ≤ 20 m, for my butterfly counts.)
To deal with counts when birds are common, I have been recording (at least) the minimum and maximum number of individuals seen and heard in each 20 minute period. I include separate counts for the first five minutes of each interval so I have data comparable to proper five minute bird count data. Still, at its simplest, even minimum and maximum counts would not be necessary. Just presence or absence in every 20 minute interval across many sites would still show long term trends in rare species.
Technology makes this all increasingly easy to pull off, now that we all carry computers, cameras, and microphones in our pockets. My iPhone can GPS track everywhere I go (I use the excellent Cyclemeter app but there are many alternatives). I built a database app in FileMaker Go for entering my presence/absence, or min/max counts, or counts of each individual seen or heard, for each species I predetermine that I’ll record at a site. My Filemaker Go app automatically date-time stamps and geotags each observation I make (although I still record a separate GPS track and extract the geotag from the GPS track by aligning the dates and times—I’ve found that this gives me higher accuracy).
To be a sustainable habit, all of this needs to be quick. To do that, I developed a shorthand for my nature observations. I’ll wait for a later post to give the complete details. At it’s simplest, to record just the kererū at a site through a morning, I could write the following.
	9:00-
	9:20-
	9:40-
	k 1|
	10:00-
	10:20-
	10:40-
	k |1
	11:00-
	-11:20
I use the pipe symbol (|) to denote the split between the first five minutes and the subsequent 15 minutes of each 20 minute interval. I use “k” as shorthand for kererū.
In essence, my method is a stripped down combination of a five minute bird count and slow walk transect. It’s simple enough to do all the time. It’s been an easy habit to get into and it captures all those rare observations of special species.
I started doing this in 2008 by consistently recording every time I saw a forest bird of a species that was in Christchurch before people. There aren’t many of those left and none are common in the city. I reported some initial results from that in my 2012 paper. I also added native butterflies at the same time. I’ve been doing that ever since, while layering on additional species as my skill increased. This will allow me to tell some of the stories of the changes happening to wild nature in Christchurch city.
We’d have a lot better idea of the trends happening in wild nature if more people got into the habit of doing such simple, consistent, and frequent monitoring of wild nature.